
Monday, February 25, 2013


Friday, February 22, 2013
Nifty weekly call -25-28 feb-2013
Nifty weekly level:
1. Nifty will retest 5960-80 may extend to 6020 this target will reach on or before 14th . trader should not hold the position 13th feb . buying level 5820-40 level St+ at 5780.
2. nifty will retest 5720 may extend to 5620 . this target will reach on or before 8th march . trader should inciate when nifty reached to 5980-6020 level (March contract) st+ at 6050.
1. Nifty will retest 5960-80 may extend to 6020 this target will reach on or before 14th . trader should not hold the position 13th feb . buying level 5820-40 level St+ at 5780.
2. nifty will retest 5720 may extend to 5620 . this target will reach on or before 8th march . trader should inciate when nifty reached to 5980-6020 level (March contract) st+ at 6050.
Thursday, February 21, 2013
nifty 50 stocks BUY/SELl level s
date 22/02/2013 valuaten for nifty 50 stocks .
How to fallow rule to trade contact or mail us
| |||||||||||||||||||||||||||||||||||||||||||||||||||||||||||||||||||||||||||||||||||||||||||||||||||||||||||||||||||||||||||||||||||||||||||||||||||||||||||||||||||||||||||||||||||||||||||||||||||||||||||||||||||||||||||||||||||||||||||||||||||||||||||||||||||||||||||||||||||||||||||||||
Wednesday, February 20, 2013
BUY/SELL level for nifty 50 stocks
Nifty 50 stocks buy above price & sell bellow price.
| nifty | 5964.0 |
| ACC | 1302.1 |
| AMBUJACEM | 193.8 |
| ASIANPAINT | 4567.0 |
| AXISBANK | 1442.0 |
| BAJAJ-AUTO | 1991.6 |
| BANKBARODA | 767.1 |
| BHARTIARTL | 308.1 |
| BHEL | 212.5 |
| BPCL | 382.4 |
| CAIRN | 310.3 |
| CIPLA | 388.3 |
| COALINDIA | 339.4 |
| DLF | 270.6 |
| DRREDDY | 1822.2 |
| GAIL | 335.0 |
| GRASIM | 3043.7 |
| HCLTECH | 706.8 |
| HDFC | 824.9 |
| HDFCBANK | 676.0 |
| HEROMOTOCO | 1675.6 |
| HINDALCO | 112.2 |
| HINDUNILVR | 477.4 |
| ICICIBANK | 1133.4 |
| IDFC | 163.7 |
| INFY | 2825.5 |
| ITC | 302.2 |
| JINDALSTEL | 376.5 |
| JPASSOCIAT | 75.4 |
| KOTAKBANK | 676.0 |
| LT | 1465.5 |
| LUPIN | 599.6 |
| M&M | 900.8 |
| MARUTI | 1513.9 |
| NTPC | 153.8 |
| ONGC | 330.3 |
| PNB | 862.7 |
| POWERGRID | 108.6 |
| RANBAXY | 422.2 |
| RELIANCE | 849.9 |
| RELINFRA | 493.0 |
| SBIN | 2277.5 |
| SESAGOA | 171.2 |
| SIEMENS | 573.9 |
| SUNPHARMA | 794.1 |
| TATAMOTORS | 307.3 |
| TATAPOWER | 97.0 |
| TATASTEEL | 387.4 |
| TCS | 1446.1 |
| ULTRACEMCO | 1958.5 |
| WIPRO | 411.5 |
Monday, February 18, 2013
SBI/RENBAXY INTRDAY CALL
SBI :
Buy above 2278 T1 - 2290 , T2 -2330 St+ at 2259
Sell Bellow 2256 T1 - 2235 & T2 - 2221 ST+ At 2270
Ranbaxy :
Buy above 411 T1 - 416 & 421 St+ AT 410
Sell bellow 407 T1 - 405 & T2 - 400 St+ 412
Buy above 2278 T1 - 2290 , T2 -2330 St+ at 2259
Sell Bellow 2256 T1 - 2235 & T2 - 2221 ST+ At 2270
Ranbaxy :
Buy above 411 T1 - 416 & 421 St+ AT 410
Sell bellow 407 T1 - 405 & T2 - 400 St+ 412
Saturday, January 12, 2013
Nifty jan-march forcasting 4880 or 7200 by year 2013
nifty will act as a resistance of 6080 till match if close above 6080 then nifty will test all time high (6350). other wise we are expecting nifty will fall up to 5440-5220 or 4890 . any level nifty may taking as a support nifty will rise up to 6500 or 7200 by end of march 2014.
Saturday, October 27, 2012
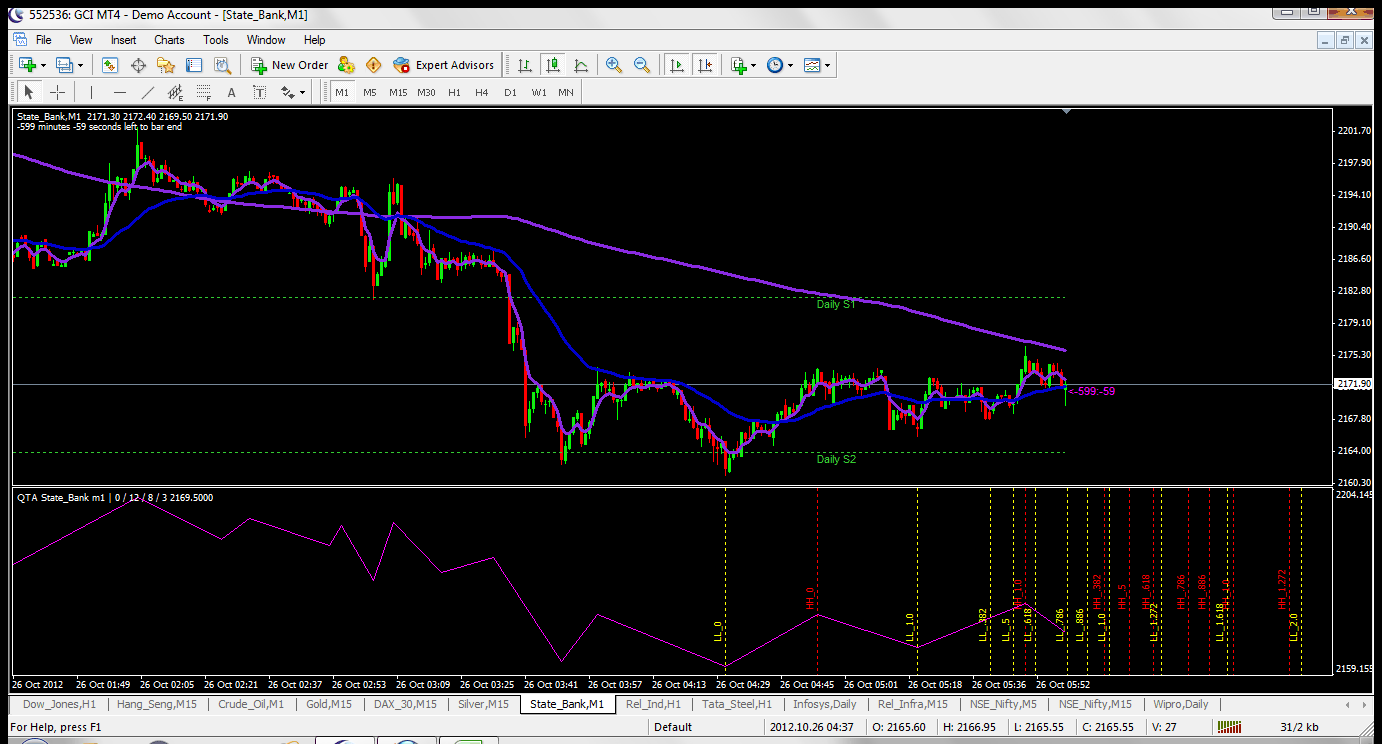
Friday, October 26, 2012

Tuesday, October 23, 2012


Monday, October 22, 2012

Monday, October 15, 2012


Saturday, October 13, 2012
buy sell indicater samples on date 12/10/12
Hear i pasted some samples photo copy attached as follows
1. SBI chart date 12/10/2012

2. NIFTY chart Date 12/10/2012

1. SBI chart date 12/10/2012

2. NIFTY chart Date 12/10/2012

Friday, October 12, 2012
Murrey Math Lines
13 Those Mystical Lines v 2.0 - Murrey Math Lines

Murrey
math lines comprise 9 equidistant lines which run parallel to one
another. MM lines from the bottom are at the levels 0/8, 1/8, 2/8, 3/8,
4/8, 5/8, 6/8, 7/8 and 8/8. 0/8 is the oversold line and 8/8 the
overbought line; these are the hardest lines to cross and around 75% of
the time, the crossing triggers price reversal. The range between 3/8
and 5/8 is the normal trading range and price tends to consolidate at
these levels before falling (3/8 line) or rising (5/8) beyond this
trading range.
Like Fibonacci retracements, when the price is between two lines, the upper line is considered as resistance and lower line is considered as support. When the price rises above 5/8 and touches 6/8, it has a tendency to reverse to retest the 5/8 level before heading high. The same is also applicable to downtrends; the price tends to reverse to retest the 3/8 level before heading down.
Caution: Murrey Math lines are a set of support and resistance lines and like any such line are NOT predictive. Which means that when you trade with these lines, there is a risk inherent in the trade, which is mitigated by the "likelihood" of price moving in the direction suggested by Murrey. Hence, any trading strategy based on Murrey Math lines or MML must have a strong risk management or stop loss overlay to avoid losing capital
Like Fibonacci retracements, when the price is between two lines, the upper line is considered as resistance and lower line is considered as support. When the price rises above 5/8 and touches 6/8, it has a tendency to reverse to retest the 5/8 level before heading high. The same is also applicable to downtrends; the price tends to reverse to retest the 3/8 level before heading down.
Caution: Murrey Math lines are a set of support and resistance lines and like any such line are NOT predictive. Which means that when you trade with these lines, there is a risk inherent in the trade, which is mitigated by the "likelihood" of price moving in the direction suggested by Murrey. Hence, any trading strategy based on Murrey Math lines or MML must have a strong risk management or stop loss overlay to avoid losing capital
13.1 Murrey Math Lines - Understanding the Levels

This graphic illustrates the following:
8/8: Hardest line to rise above (overbought)
7/8: Fast reverse line (weak)
6/8: Pivot reverse line
5/8: Upper trading range
----------------------------------------
4/8: Major reversal line
----------------------------------------
3/8: Lower trading range
2/8: Pivot reverse line
1/8: Fast reverse line (weak)
0/8: Hardest line to fall below (oversold)
8/8: Hardest line to rise above (overbought)
7/8: Fast reverse line (weak)
6/8: Pivot reverse line
5/8: Upper trading range
----------------------------------------
4/8: Major reversal line
----------------------------------------
3/8: Lower trading range
2/8: Pivot reverse line
1/8: Fast reverse line (weak)
0/8: Hardest line to fall below (oversold)
 What this
is showing us is that many times, if price is above the 5/8 line and
falling, it will generally stop and consolidate around 5/8 first before
heading lower. The same is true in the opposite direction: if price is
below the 3/8 line and rising, it will generally stop and consolidate
around the 3/8 line before heading higher.
What this
is showing us is that many times, if price is above the 5/8 line and
falling, it will generally stop and consolidate around 5/8 first before
heading lower. The same is true in the opposite direction: if price is
below the 3/8 line and rising, it will generally stop and consolidate
around the 3/8 line before heading higher.On top of that, if price is between the 5/8 line and 6/8 line and heading higher, the tendency is to bounce off/reverse off the 6/8 line and retest 5/8 before heading higher. The same is true for shorts, if price is between the 3/8 line and 2/8 line and heading lower, it tends to bounce off the 2/8 line and retest 3/8 before heading lower.
Why does price do this? Remember, price is between the 3/8 and 5/8 line about 43% of the time. So before it jumps outside of its comfort zone, it needs to be sure (hence the retest).
Now let's take a quick look at what happens when price moves above 8/8 or below 0/8. This does not occur too often, but when it does it's important to know what to expect.
The above illustration tells us the following: If price moves above 8/8, 75% of the time the price will reverse off the +1/8 line and retest 8/8 before moving higher to +2/8. Similarly, if price falls below 0/8, 75% of the time the price will reverse off the -1/8 line and retest 0/8 before moving lower to -2/8.
Now, if price moves beyond the +1/8 or -1/8 lines, then 95% of the time it will reverse when it hits +2/8 or -2/8. Remember, the market was already in overbought (8/8) or oversold (0/8) mode, so once we push that to the extreme (+2/8 or -2/8) it is extremely unlikely (95% chance) to reverse.
Wednesday, October 10, 2012

Monday, September 3, 2012
September 4th 2012 nifty targets
Up side target 5330 and Down side target is 5241.trend is in down side if nifty bricking 5270 bellow target is 5241
sep-3rd 2012 Down target achieved. ( i.e 5274)
sep-3rd 2012 Down target achieved. ( i.e 5274)
Sunday, September 2, 2012
Rules of Open Interest
- If prices are rising and the open interest is increasing at a rate faster than its average, it is a bullish sign.
This indicates that more participants are entering the market, involving additional buying, and any purchase is generally aggressive in nature. - If the open-interest numbers flatten, following a rising trend in both, price and open interest, take this as a warning sign of an impending top.
- High open interest at market tops is a
bearish signal if the price drop is sudden, since this will force many
'weak' longs to liquidate.
Occasionally, such conditions set off a self-feeding downward spiral. - An unusually high or record open interest in a bull market is a danger signal.
When a rising trend of open interest begins to reverse, expect a bear trend to get underway. - A breakout from a trading range will be much stronger if open interest rises during the consolidation.
This is because many traders will be caught on the wrong side of the market when the breakout finally takes place.
When the price moves out of the trading range, these traders are forced to abandon their positions.
It is possible to take this rule one step further and say that greater the rise in the open interest during the consolidation, greater is the potential for a subsequent move. - Rising prices and a decline in the open interest at a rate greater than the seasonal norm is bearish.
This market condition develops because short covering and not fundamental demand is fueling the rising price trend.
In these circumstances, money is flowing out of the market.
Consequently, when the short covering has run its course, prices will decline. - If prices are declining and the open
interest rises more than the seasonal average, this indicates that new
short positions are being opened.
As long as this process continues, it is a bearish factor.
However, once the shorts begin to cover, it turns bullish. - A decline in both, price and open interest indicates liquidation by discouraged traders with long positions.
As long as this trend continues, it is a bearish sign. Once open interest stabilizes at a low level, liquidation is over and prices are then in a position to rally again.
If prices are rising and the volume and open interest are
both up, the market is decidedly strong. If prices are rising and the
volume as well as open interest are both down, the market is weakening.
Now, if prices are declining and the volume and open interest are up,
the market is weak. However, when prices are declining and the volume
and open interest are down, the market is gaining strength.
nifty 3rd -sep 2012 forcasting
Targets for September 3: Up 5337 and
Down 5274. In case of one sided movement, or consolidation, one or both
targets will be irrelevant.
medium term is berries if 5260 below target is 5170-60
medium term is berries if 5260 below target is 5170-60
Sunday, June 24, 2012
nifty weekly view 24th to 29th jun 2012
nifty weekly view is in sell side . trader can sell rise near to 5170-90 level . traget is 5050-5020
 call validity till friday.

Subscribe to:
Posts (Atom)