Thursday, February 3, 2011

golden nifty call - Date -4/02/2011

Again nifty fail to test 5350 . today nifty will trade in the range b/n  5470 – 5545.
Trader can take long at 5470  profit book at 5520 & sell at 5540  profit book at 5490 .

Nifty will be move in the range b/n 5450 – 5565  in next 3 to 4 trading section.

yesterday trading calls details.

Today nifty position details(03/02/2011)
Cataract Buy dateSell dateBuy Price  sell Price no.of lotnet earningProfit
nifty-6000 jun-call 03/01/2011Holding4562
nifty -5700-mar-call02/02/201102/03/2011851025854250
nifty -5700-mar-call02/02/2011Holding1025
nifty -5500-Feb-put02/03/201102/02/2011985
Nifty- feature02/03/201102/03/20115450553221648200

mail id : shashi_jm

Wednesday, February 2, 2011

Golden nifty call ( Date 03/02/2011)

today nifty trading calls as fallows.

Today nifty position details(02/02/2011)
Contract Buy dateSell dateBuy Price  sell Price no.of lotnet earningProfit
nifty-5400-call1/02/02/201102/02/20111271552562800
nifty -5500-put02/02/201102/02/20111081362562800
nifty -5700-mar-call02/02/201102/02/2011 Holding10210


tomorrow is the last day to test 5350 if fails . this is the bottom for the Feb.contract.& today is very important  day . there is a chances nifty can fall up to 4890 ( supporting levels for the nifty   is 5350-5200-4890).    

Mail id : shashi_jm@yahoo.com

Tuesday, February 1, 2011

golden nifty call date 02/02/2011

today nifty fail to reach the 5350 level . still one more day chances are there to test 5350. if nifty going bellow 5350 level next level is 5200 .

More details subscribed clients only.

Today trading calls:(1/02/2011)

Today nifty position details(01/02/2011)
Cataract Buy dateSell dateBuy Price  sell Price no.of lotnet earningProfit
nifty-6000 jun-call 03/01/2011 holding4562
nifty-5600 -put31/01/2012 01/02/201115021021206000
nifty-5500 -put01/02/201101/02/20111051551050025000


Monday, January 31, 2011

golden nifty call Date 1/2/2011

as per our call 5600 put traded near to our recommended price i.e 135-145.  tomorrow we expecting big down Spike  may be  up to 5350 level . if it is bellow expected to 5200 is next level. trader should watch important level is 5350. if it holds next target will be 5540. before 4/02/2011.

Investor alert. : February month contract will expiry   25 points  + or - 5600 level.

Today our Trading Position:

Today nifty position details(31/01/2011
Cataract Buy dateSell dateBuy Price  sell Price no.of lotnet earningProfit
Nifty- feature28/01/201131/01/2011556055402-40-2000
Nifty- feature28/01/201128/01/2011551555452603000
nifty-6000 jun-call 03/01/2011Holding4562
Nifty- feature31/01/201131/01/20115445 551021306500
nifty-5600 -put31/01/2012Holding1502


Mail id : shashidhara.jm


Friday, January 28, 2011

golden & multibager nifty option call date 31/01/2011


power of option position call

Monday is a good opportunity to by 5600 put at  135-145 level  target is  300-350 on or before 2/02/2011  time 2: 30- 3:00 pm. before reaching target there is a two up's & downs oscillation
 we are expecting big down spike on 2/02/2011, time 2:30-3:00 pm . trader can take long position at specified time near to low price. trader miss the buying opportunity on 2/2/2011 you will get one more chance on 3/02/2011  before 12:00 noon. we recommend to entry  price b/n 5350-75 . target  is 5500 on or before 4/02/2011.

Mailid : shashi_jm@yahoo.com
Mobil : 9341305622


Monday nifty trading call

Trader can sell above 5580.  we recommended the position at 5560 level on 27/01/2011 . cover the position at 5580 on 31/01/2011 . Monday market will open at 5580 level . nifty will test 5450 by 1/02/2011.

Inter day trend reversal & st+ will be disclosed  to clients only.


28/01/2011  our trading position as fallows

Today nifty position details
Contract Buy dateSell dateBuy Price  sell Price no.of lotnet earningProfit
Nifty- feature28/01/2011Holding55602
Nifty- feature28/01/201128/01/2011551555452603000
nifty-6000 jun-call 03/01/2011Holding4562


Mail id : shashi_jm@yahoo.com

Thursday, January 27, 2011

Free nifty call

we recommend free call one week for trial . we will recommend one day advance, it will be updated at 9 pm every day.

fallow tomorrow  nifty level.

Trader can take long  at 5560-80 level  target 5640-50  on or before Monday.. if reaching inter day trader should cover their position. option buying is not good. tomorrow is premium decay  day. 

Mail id : shashi_jm@yahoo.com

Tuesday, January 25, 2011

50000/- profit in Jan month

Dear  invester as per our call perfarmence report  . Total investment of  Rs 100000/-  still 2011 Jun 6000 call sell holding .

Cotract Buy dateSell dateBuy Price  sell Price no.of lotnet earningProfit
Nifty-6200 Jan-put03/01/201111/01/201190400262031000
Nifty-5800 jan-put301/201114/1/201189821809000
Nifty-5700jan-call14/01/201117/01/201165882462300
Nifty-5800 jan-put21/01/201121/01/2011881052341700
Nifty-5800 jan-put25/01/201125/01/20113610021286400
nifty=5800 jan-put27/01201127/01/2011167521185900
nifty-6000 jun-call 03/01/2011Holding 4562  
Total profit in Rs -56300

Wednesday, January 19, 2011

Date 20/01/2011 nifty Intrady call

Trader can take long  at 5650 level . at the end of the day  nifty will re test 5730-60
today taking log is risky . more safe to sell above 5720-30 level  trader can hold till expiry. target is 5500

more details only clients only.

Mail Id : shashi_jm@yahoo.com

Tuesday, January 18, 2011

Nifty January Month contract expiry level

Nifty may maximum pull back to 5760-90  before Thursdays. we expected nifty will expiry will be  near to 5500 level ( it may be 5480-5525).trader can take 5800 put at  Rs  60-70 level target is 260-300 on thursaday .
Tomorrow nifty trading level( 19/01/2011) : trader can take long position at 5695 level  target for the day 5764  finally nifty will be closing near to 5700-10. Trader can trade accordingly.

Tuesdays we recommended to our clients : 5700 put buy at Rs70  (10 lots ) covered at  Rs90 - total profit  Rs- 10000/-

More details only for clients only.
Mail id : shashi_jm@yahoo.com

Monday, January 17, 2011

nifty intrady call Date 18/01/2011

Monday nifty is trading in the range bond due to Indian currency & gold are trading in choppy & neutral mode . nifty will move any one should be drastic changes in price. we recommended our client buy 5700 call at 65-70  on Monday  exited at 82 (10 lots) due to above reason. choppy section will be continue tomorrow also range b/n  5590-5690. tomorrow is not good far option trader.

Sunday, January 16, 2011

golden nifty option call oportunities

Dear invester our call are target with accurate time calculated call ( please see our sample calls posted on 3rd & 14th jan  how exactly time slote pries are reaching target that is power gann method.)

Dear investet  ther is a good oportunity position calls on 17th jan earnig potencial Rs 50,000/ in 4 to 5 trading section & 24th also one more option positinal call earnig potencial of Rs 50,000/

positinal entry Date & level of price disclosed only far subsribers only.

Mail id : shashi_jm@yahoo.com.

Monday, January 10, 2011

nifty positnal call on Date 14/01/2011

Trader can inciate long on Friday 2:30 -3:00 pm (Date 14th Jan) near to low price  i.e it may be 5580 -90  ( 161% re-tracement) or it may be at  4960-80  ( i.e 261%  re-tracement )  nifty going bellow 161% ( 5580) after 1 pm  there is chances of 10% lower circute.
Target for the nifty if reversing at 5580  it will hit 6050 on or before 24th jan.

More details : Clients only
Mobil no:  9341305622

Wednesday, January 5, 2011

5/1/2011 nifty trading levels

today market will move in the range of  6065- 6135   at finaly nifty will be close  + or -  5 points only.
Trader can buy near to 6068  & sell near to 6135 . finally  trader will get both  side making money.

more details : clients only

Sunday, January 2, 2011

Nifty Golden call ( Date 3/01/2011)

This is a golden chance to buy 6200 put Jan   at 100-110    Target is 400-500  on 14th or 17th of this month

Far more details clients only
contact no : 9241305622

Friday, December 31, 2010

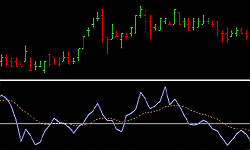
Klinger Oscillator : Application and Chart

The KO was developed by Stephen J. Klinger with two opposite goals in mind:
1. To be sensitive enough to signal short-term tops and bottoms
2. To be accurate enough to reflect the long-term flow of money into and out of a security.
The KO is based on the following trends:
  • Price range whether high or low, is a measure of movement and volume is the force behind the movement. The sum of High + Low + Close defines a trend. Accumulation occurs when today’s sum is greater than the previous day’s. Conversely, distribution occurs when today’s sum is less than the previous day’s. When the sums are equal, the existing trend is maintained.
  • Volume produces continuous intra-day changes in price reflecting buying and selling pressure. The KO quantifies the difference between the number of shares being accumulated and distributed each day as “volume force”. A strong, rising volume force should accompany an uptrend and then gradually contract over time during the latter stages of the uptrend and the early stages of the following downtrend. This should be followed by a rising volume force reflecting some accumulation before a bottom develops.
  • By converting the volume force into an oscillator representing the difference between a 34-period and 55-period exponential moving average with a 13-period trigger, the force of volume into and out of a security can easily be tracked. Comparing this force to price action can help identify divergences at tops and bottoms.
Application in Stock market
The following guidelines are recommended to use the Klinger Oscillator :
  1. The most reliable signals occur in the direction of the prevailing trend. Strict stop guidelines (i.e., failure to penetrate the zero line or a violation of the trigger line) should remain in force.
  2. The most important signal occurs when the KO diverges with the underlying price action, especially on new highs or new lows in overbought/oversold territory. For example, when a stock makes a new high or low for a cycle and the KO fails to confirm this, the trend may be losing momentum and nearing completion.
  3. If the price is in an uptrend (i.e., above an 89-day exponential moving average), buy when the KO drops to unusually low levels below zero, turns up, and crosses its trigger line. If the price is in a downtrend (i.e., below an 89-day exponential moving average), sell when the KO rises to unusually high levels above zero, turns down, and crosses its trigger line.
An Important Trading Tip
Plot a 13-period moving average of the formula as a trigger line for entering buy and sell trades.

Saturday, December 25, 2010

EMA of 34& 8 technical analysis

This was shared by Mr.Partha in Mudraa last week but got ignored somehow. This is too good to be ignored. You are missing a Jackpot. This single strategy is enough to make good money. Pl note that this is not for Day Trading but amazingly effective for short-to-medium term trading.


The difference in this strategy is that here there are 3 characters instead of two.


1) EMA 34 line
2) EMA 8 line
3) Priceline


EMA 34 is effectively 1 month weighted average
EMA 8 is effectively 1 week weighted average
A) When price cuts EMA 34 from below, Buy.
Square off when it cuts EMA 8 from above.
If it again goes above EMA 8 , buy again.
.....
B) If the price cuts EMA 34 from above, Short.
Square off when it cuts EMA 8 from below.
If it again dips below EMA 8, short again.

interaday brick out trading strategy

This is a very simple and traditional trading strategy based on Breakout. I use Fibonacci ratios to get the targets & Stoploss. When the Day high/Day Low broke there will be some pressure, we are going to use this pressure in this strategy.

From 9.00AM to 9.30AM just watch the market. Take the 30 mins high & 30 mins low.

Mostly Market will break high/low with in 10.30am.

Trade Trigger
We should buy @ High Break
We should short @ Low Break

I use the Fibonacci Ratios (0.5, 0.618, 0.786, 1) to get targets & Stoploss.

SL
Long SL= Buy Price - (High-Low)*0.5
Short SL= Sell Price + (High-Low)*0.5

Targets
Long T1 = Buy Price + (High-Low)*0.618
Long T2 = Buy Price + (High-Low)*0.786
Long T3 = Buy Price + (High-Low)*1

Short T1 = Sell Price - (High-Low)*.0.618
Short T2 = Sell Price - (High-Low) *0.786
Short T3 = Sell Price - (High-Low) *1

Thursday, December 23, 2010

24/12/2010 nifty trading level

nifty how long will not cross 6004 it will test 5960 initially   then next target will be 5870  this is 180 degree of gann level. today trader can go sell with  a st+ at 6010

Wednesday, December 15, 2010

nifty trading strategy on Date 16/12/2010

Tomorrow  nifty will pull back to 5970-75 . this will be happen after RBI credit policy   . 5970-75 is the good time to go short  target is 5800 & 5700 initially  if bricks bellow 5700 nifty will  catch 5425.

for more details clients only


contact no : 9341305622

Monday, December 13, 2010

nifty positional call

Nifty reaching all most 1st target investor should cover long position  & buy 5900 or 6000 put  nifty will pull back to 5750 or 5500  before 24/12/2010.

Friday, December 10, 2010

nifty positional call

After  fall to 5750 pull back to 5870  . Monday if sustains  above 5875  i.e 38.2 % re-trace level  .comming days nifty will retest   5990  & 6090  ( 70.7 & 100% re-trace) this will happen before  16/12/2010.
once it reaches to 6090  full short covering will compete in the system,  from there we expecting big fall up to 5650 level  

Far more details of level  open XL sheet attached

contact no: 9341305622

gold positinal trading

Gold is retraced back to 70.7% ( From  1350-1431$ )   i.e  1372$    in comming days gold will retest    to  1431 $ before 21/12/2010 keep st+ at 1/8 bellow value of 1372$.

For more details clients only

contact no: 9341305622